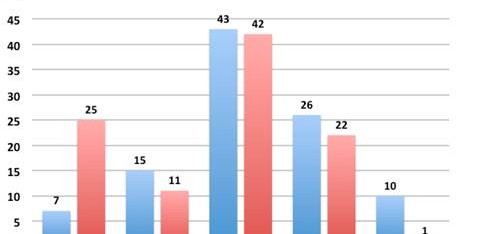
If you work anywhere near media, you’ll want to take a long look at this graph. It tells you where Americans direct our attention (in BLUE) and where advertisers pay money to capture our attention (in RED).
— Takeaway #1: We still love TV.
— Takeaway #2: Advertisers still love print.
— Takeaway #3: Audiences move faster than advertisers.
According to this chart — adapted from a Mary Meeker slideshow excerpted by Bill Gross — we spend more time engaging with mobile devices than reading print. But print publications still get25-times more ad money than mobile. Either the eyeballs are moving faster than the advertisers, who will eventually stop paying for print … or the ad teams don’t think a minute spent around mobile ads is worth a minute spend around print ads. Those aren’t mutually exclusive.
We can take this chart in a lot of directions. Could print see another mass exodus of money? Is mobile advertising about to explode? I want to talk a bit about Facebook and attention.
Since the Facebook IPO, I’ve been thinking a lot about attention. Facebook is the deepest and widest social media site in the world. In the online attention food chain, Facebook isn’t the lion. It’s the Great-White-Shark-Tyrannosaurus-Rex-Lyger hybrid. It eats everybody’s lunch, twice, just to make a point. Its user base is one-seventh of the world population. It claims one out of every five page views on the Internet. If we’re really moving toward an attention economy, Facebook is poised to dominate.
But in one key measure of attention economics, it doesn’t dominate at all. The metric is "average revenue per user", or ARPU. That tells you how much money you’re making from a typical customer. LinkedIn makes $7. Facebook makes $5. For unfair comparison’s sake, Comcast makes $1,740.
Now, ARPU is a flawed statistic, because not all users are equal. Some media companies have subscribers. Others are all free and ad-supported. Google makes most of its money from searches rather than display advertising on a website with a log-in and original content. But the point is: Look at the Internet companies below, and look at the newspapers, and tell me who’s dying.

Remember takeaway #2: Advertisers still love print. Facebook’s challenge is the Web’s challenge. Can you convince marketing firms that an eyeball on a screen is worth an eyeball on paper? Until they do, Facebook’s online ad strategy might wind up expanding the supply of an already-cheap commodity. That’s not a $100 billion plan.


")


